App设计中数据图表的12种展示方式 - 12图

时间:2018-05-12
来源:Dribbble
观众:3.2w
  • App设计中数据图表的12种展示方式

    SpiderAf Dashboard Mobile by Art Lemon

  • App设计中数据图表的12种展示方式

    Internet Speed test App by Kalesh 

  • App设计中数据图表的12种展示方式

    Cryptocurrency App Dashboard by Ryan Sael ✪

  • App设计中数据图表的12种展示方式

    Mobile-Web Dashboard by Johny vino™

  • App设计中数据图表的12种展示方式

    Dashboard Iphone X Dark & White by Hashan

  • App设计中数据图表的12种展示方式

    Car Application by Sujeet Mishra

  • App设计中数据图表的12种展示方式

    Restaurant Overview - Mobile Dashboard White or Dark by Masudur Rahman 

  • App设计中数据图表的12种展示方式

    Cryptocoin Dashboard concept by Yuri Del Duca

  • App设计中数据图表的12种展示方式

    Coindesk by uixNinja

  • App设计中数据图表的12种展示方式

    Crypto Currency App - Market & Wallet Balance by Goran Tomičić

  • App设计中数据图表的12种展示方式

    Mobile Dashboard UI by Gabriele Licheri

  • App设计中数据图表的12种展示方式

    Crypto Currency App Dashboard by Nazirul Hoque 🏆

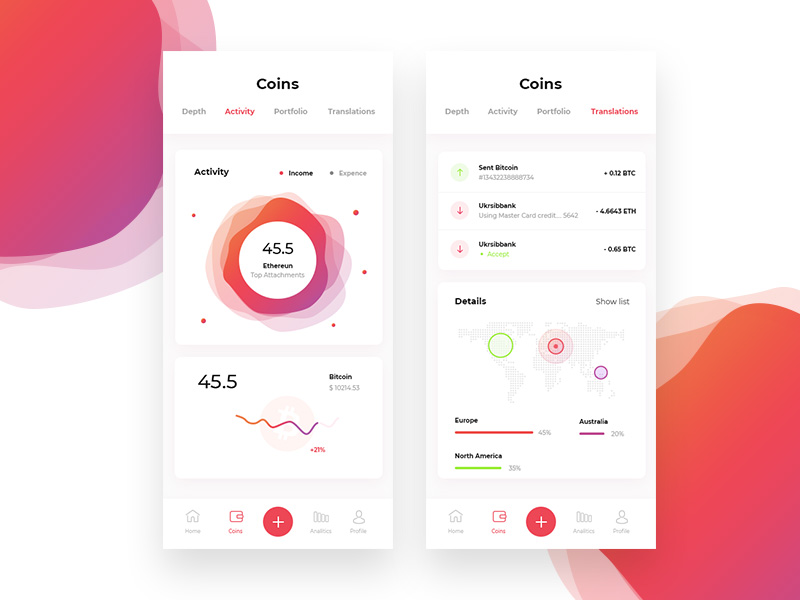
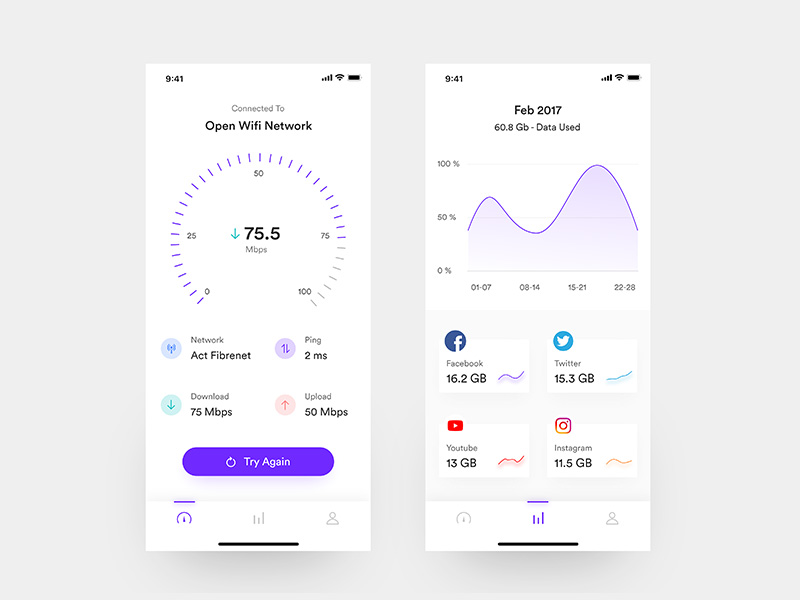
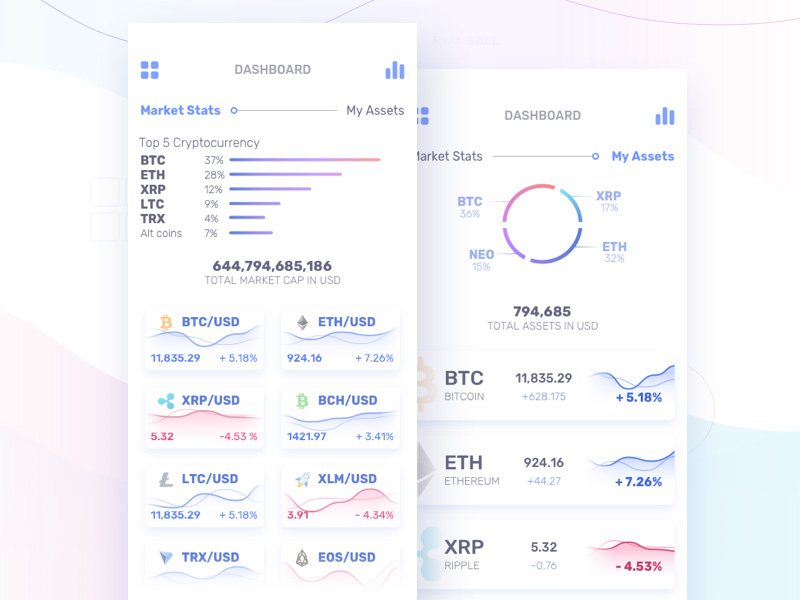
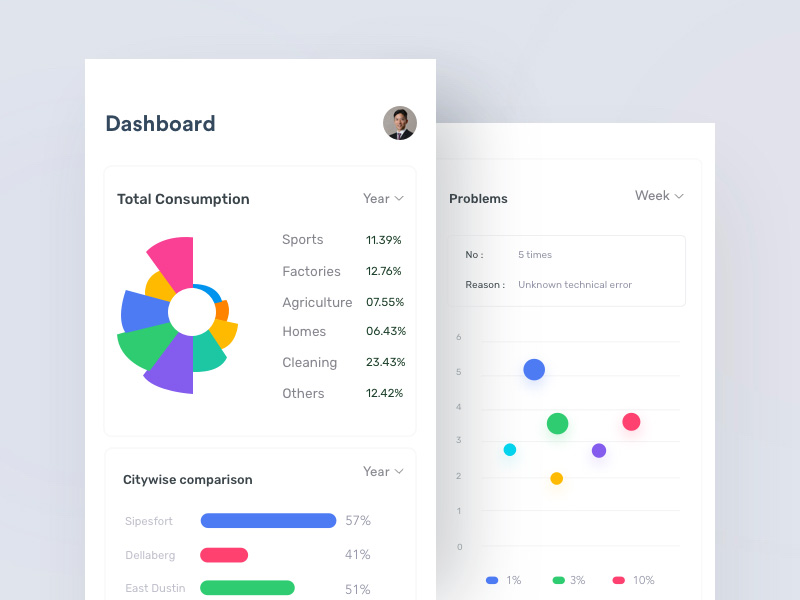
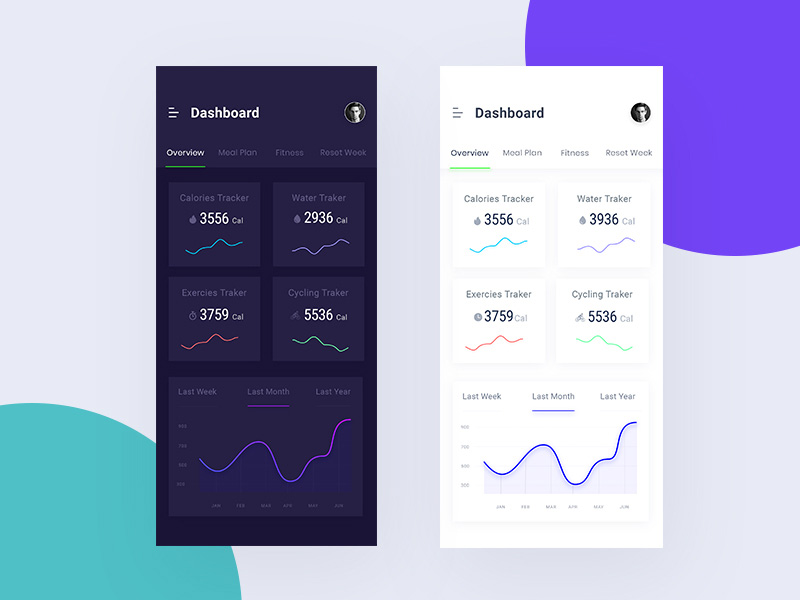
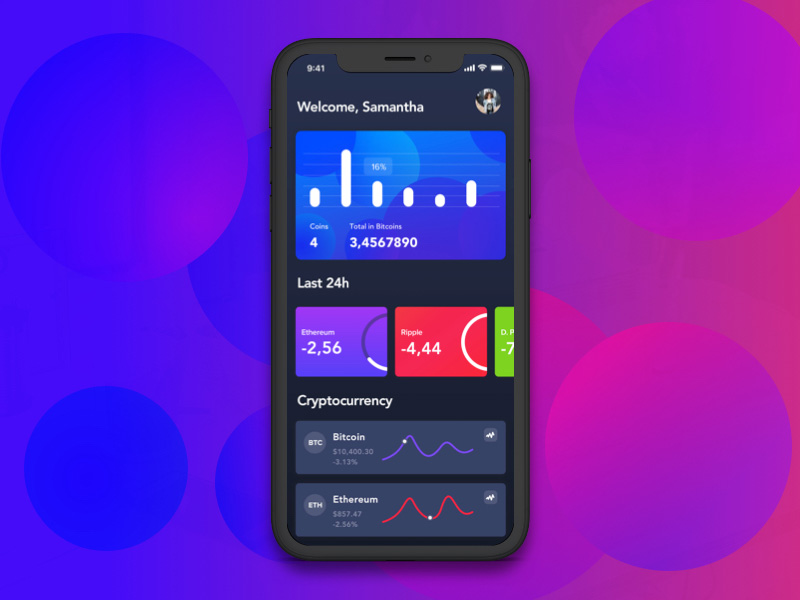
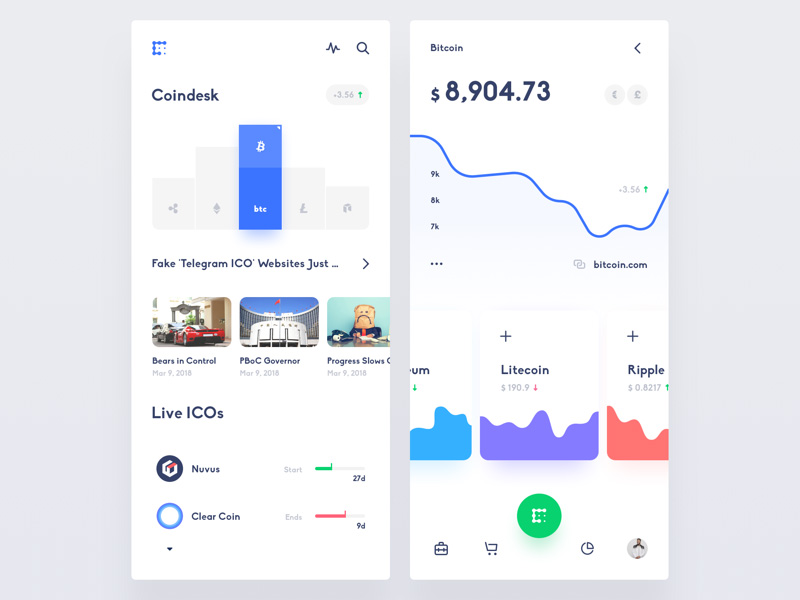
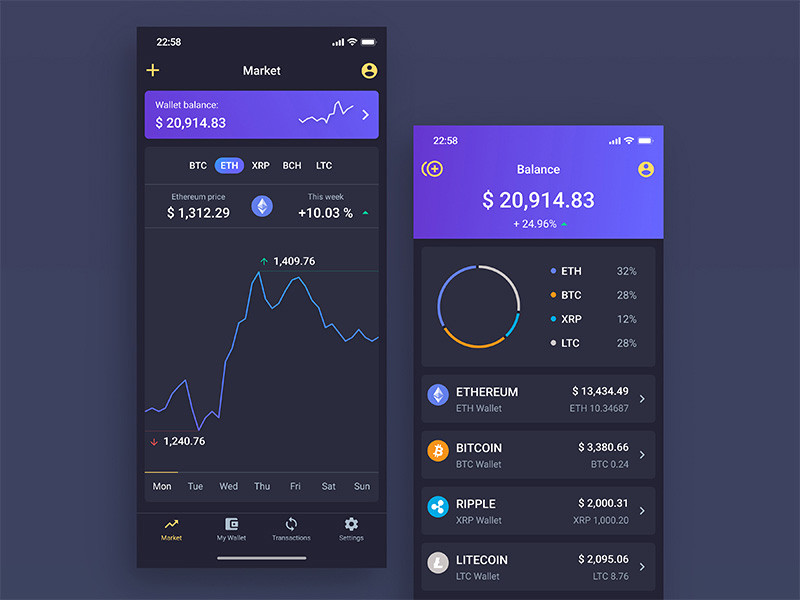
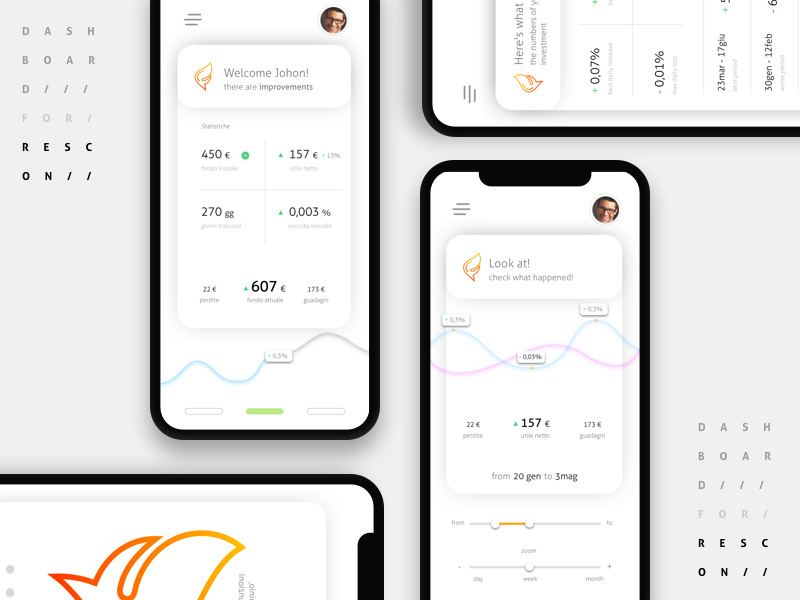
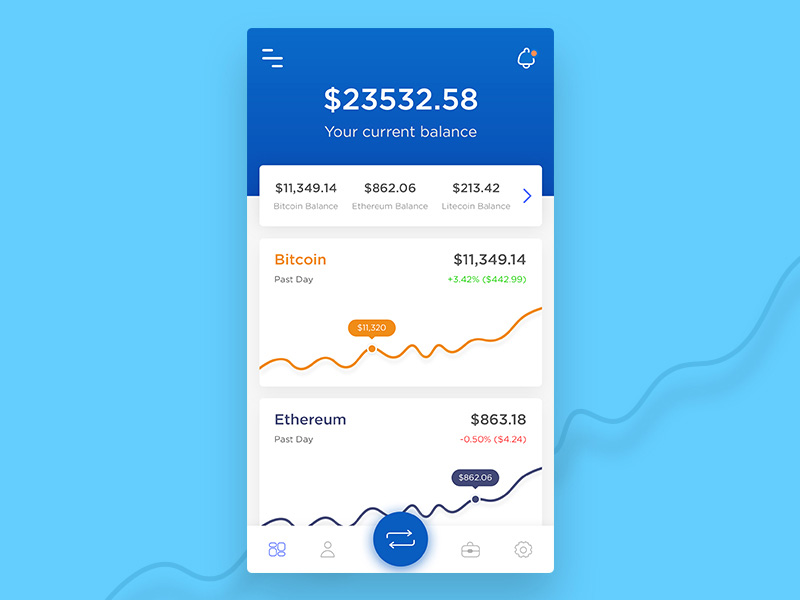
数据用来量化信息,而图表就是用来可视化数据,让繁杂的数字变得更加直观可见,12个案例教你在App中正确使用图表

97 收藏 38

发表评论 快来秀出你的观点

还可以输入 800 个字
yzm
 
 
加载更多评论
没有更多评论了
/

支持键盘 ← → 键翻阅图片

/

支持键盘 ← → 键翻阅图片